
Evolution of Cricket: Unveiling 30 Years of Transformative Trends and Insights
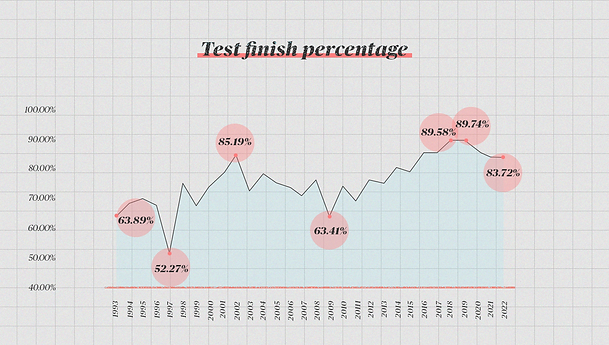
In crafting the visualizations for the data presented in this article, a meticulous process unfolded, beginning with dissecting the intricate numbers that narrate the story of cricket's transformation over the past 30 years. Each key parameter, from run rates and batting averages to match outcomes and player workloads, was carefully examined to capture the nuanced shifts in the game's dynamics.
The journey from raw data to visually compelling graphics involved breaking down complex statistical trends into digestible insights. The design prioritized clarity, ensuring that even the most intricate details were accessible to users.
Role: Data Visualization Specialist, Art Director, Motion Designer, UX Designer


Things India need to do to win in England
In this insightful feature on what India needs to do to secure victory in England, each point, from the anomalies of defensive players to countering the opposition spinner, is presented with clarity, making the article not only informative but visually enriching for cricket enthusiasts.
Role: Data Visualization Specialist, Art Director, Brand Consistency Manager


